
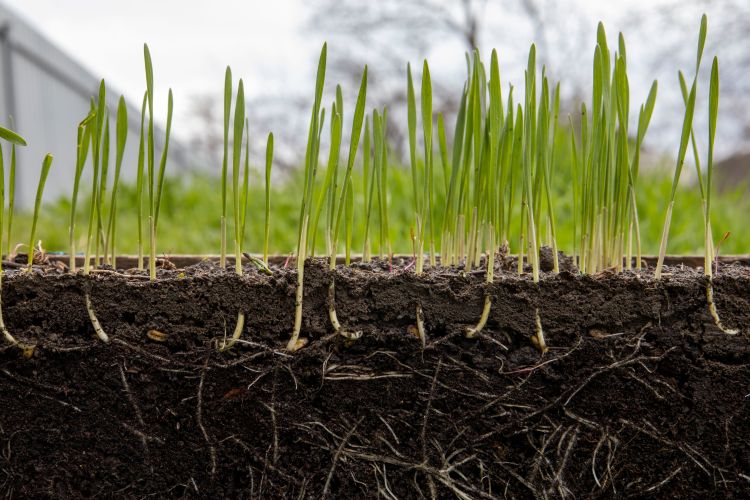
The soil’s „fingerprint”
Pfeiffer soil chromatography is a simple method that allows farmers to gain insight into the life of the soil on their own
We can collect a wealth of data about the soil. Laboratory tests reveal the pH, the organic matter content, the phosphorus and potassium levels, and the amounts of other nutrients. But anyone who has been farming for a long time knows that the condition of the soil cannot be described by numbers alone. In fact, for many people, the numbers obtained from soil tests hardly mean anything. Soil structure, biodiversity, humus quality, and biological processes all work together to determine how alive and healthy a soil is.
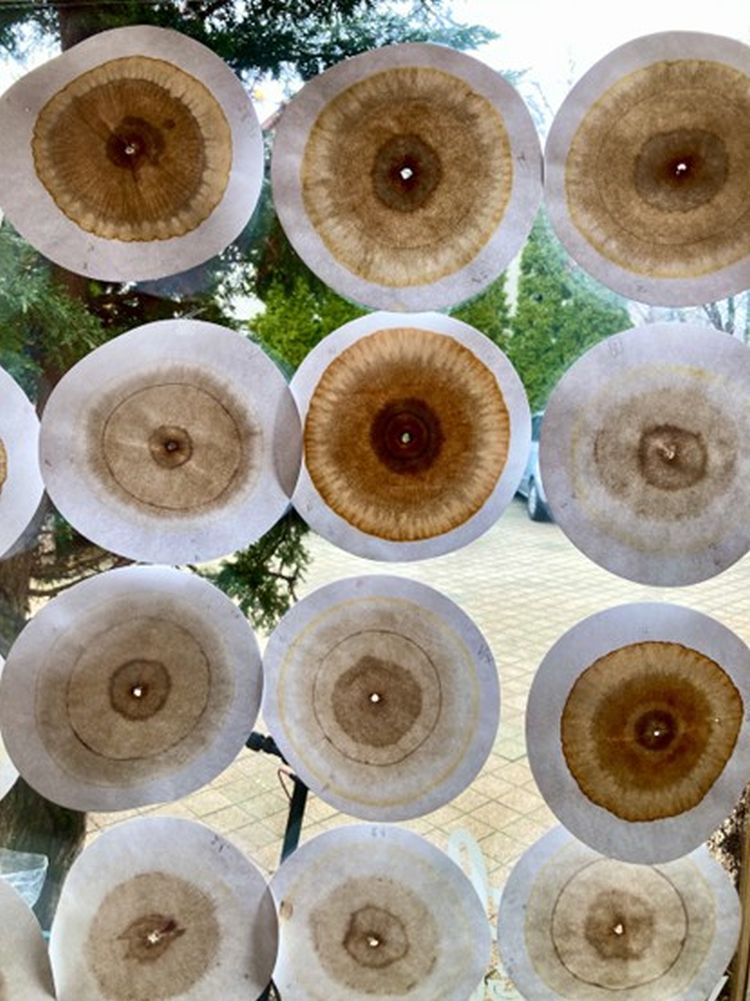
There is a unique method, which transforms this complex state into an image. This is circular chromatography, which creates a striking pattern on filter paper from a soil sample. The rings, radii, and colors of the sample serve as a kind of visual fingerprint, revealing the condition of the soil.
In recent years, this method has been attracting increasing interest among regenerative and organic farmers. And for good reason.
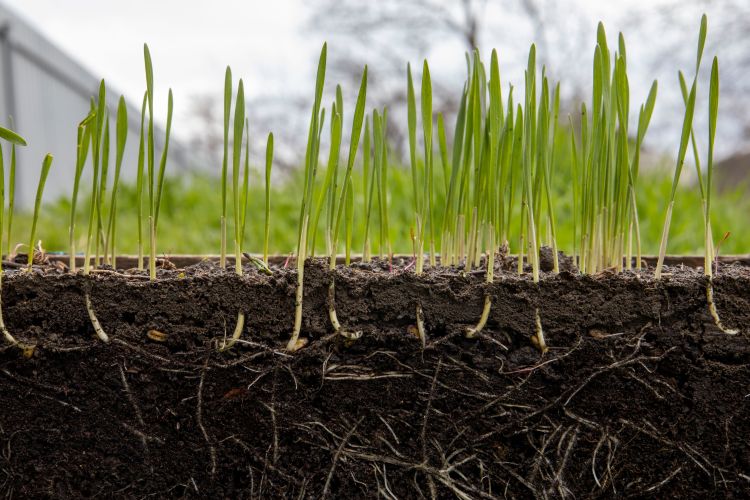
When the condition of the soil becomes visible
In February 2026, the Association of Soil-Regenerating Farmers organized a special training session for its members. They invited Marie-Thérèse Gässlert, an employee of Gässler SAS in France, to demonstrate the practice of circular chromatography to Hungarian farmers.
The Gässler family’s farm has been operating according to a regenerative approach for more than twenty years. Not only do they successfully run their own farm using regenerative methods, but they have also helped thousands of farmers in France and Germany adopt regenerative practices. Their system is based on no-till, a cover crops its use and the promotion of soil life. They monitor the condition of the soil and plants using several methods: plant sap analysis, the Kinsey-Albrecht soil test, and ring chromatography. For them, ring chromatography serves as a form of visual feedback.
As Marie-Thérèse Gässler put it, the quality of their soils has improved significantly over the past few decades, but the droughts of recent years have set this process back. Interestingly, this change is also clearly visible in the chromatograms.
The condition of the soil is therefore not only measurable but can also be visualized using circular chromatography. The method is not new. Scientists and farmers have been immersed in the preparation and interpretation of chromatograms for nearly a century.
An idea that's nearly a hundred years old
The origins of this method date back to the early 20th century. The Kolisko couple were the first to apply the basic principle of capillary chromatography when they studied the absorption of liquids on paper.
This approach was further developed by the Swiss biochemist Ehrenfried Pfeiffer, who worked as a researcher in biodynamic agriculture. His goal was to find a method that would illustrate the complex functioning of the soil in a single image.
This is how Pfeiffer's circular chromatography came to be
The essence of the method is simple: a soil extract is spread out on a filter paper, and the substances it contains migrate at different rates. On paper treated with a silver nitrate solution, these components create patterns of various colors and shapes.
The final result is a circular image featuring rings, rays, and subtle textures. These patterns vary dramatically depending on the type of soil.
How is a chromatogram created?
One of the greatest advantages of this method is that it can be performed using relatively simple equipment. The test requires a circular filter paper, a silver nitrate solution, and an alkaline soil extract. The soil sample is first dried, sieved, and then extracted with a sodium hydroxide solution.
The extract is then drawn through a small capillary tube to the center of the filter paper, where it spreads out radially. During this process, the dissolved inorganic and organic substances react differently with the silver ions, resulting in the characteristic patterns. After a few hours, the chromatogram emerges: a circular image that is often quite spectacular.
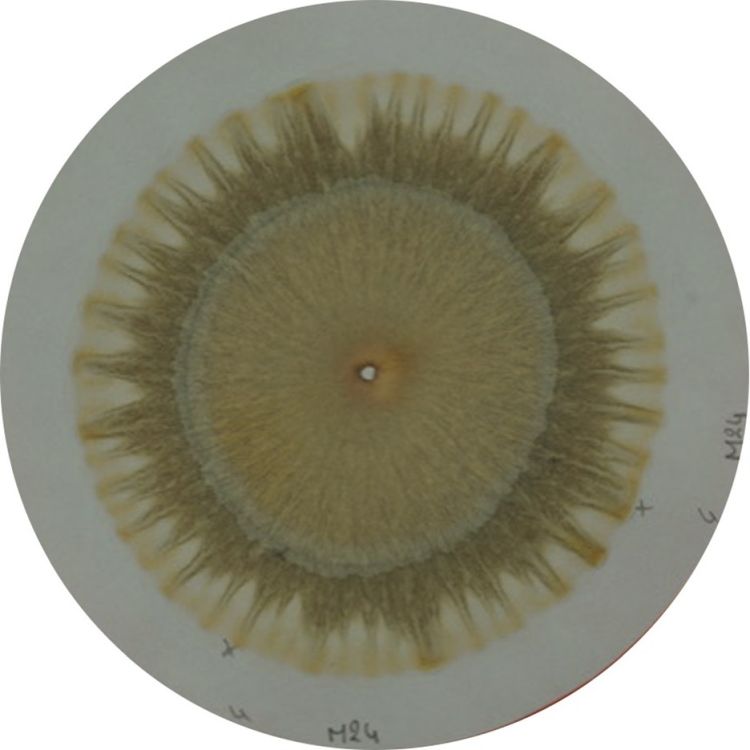
(Photo: taken by the author)
What can be determined from a chromatogram?
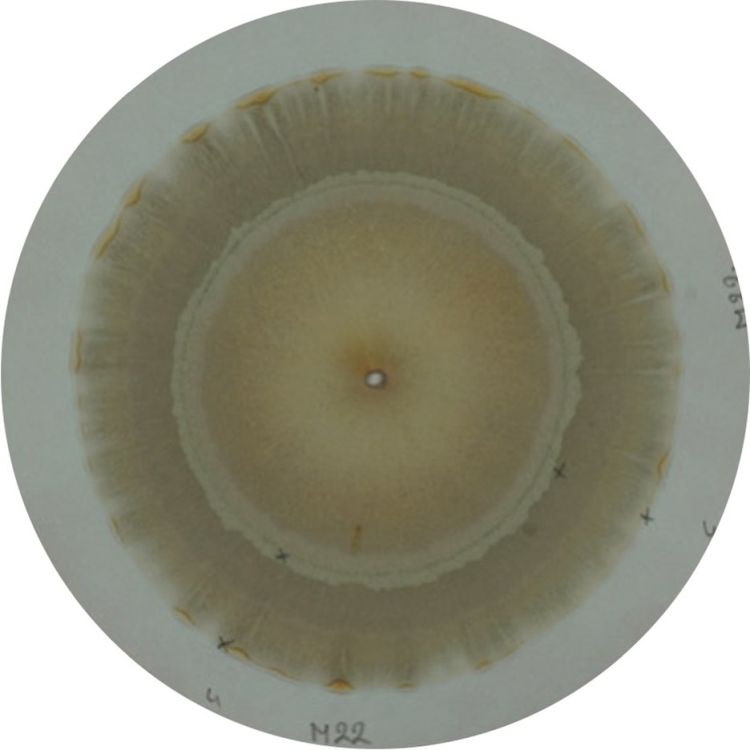
Pfeiffer identified three main zones on the chromatogram. The inner zone is located in the center of the paper. It mainly reflects soluble minerals and more mobile organic components. If this section is too dark or dense, it often indicates an imbalance or high salt content.
The intermediate ring is associated with organic matter and fungi. A wide, finely structured ring generally indicates a higher organic matter content. If this zone is narrow or unstructured, it often indicates poorer soil condition.
The outer zone may exhibit radial patterns, known as „spikes.” These structures are often associated with biological activity in the soil. Vivid, radial patterns generally indicate active soil life. The variety of spikes suggests a high diversity of bacteria living in the soil.
Marie also drew attention to the center of the filter paper: the lighter the area around the center of the circle, the better the soil’s aeration. The darker it is, the more compact the soil. Furthermore, if the chromatogram is crisscrossed by fine threads radiating from the center all the way to the edge, this indicates that we have well-structured, aggregated soil in which biological processes can function effectively and fungi permeate the entire system.
Experienced interpreters pay attention not only to individual elements, but also to the harmony of the entire image. Together, the zones form a holistic picture in which color intensity, transitions, symmetry, and subtle structural details are all equally important. The greater the harmony among the zones and the more blurred the transitions between them, the more aerated the soil is, the better nutrient management functions, and the more balanced the microbiological activity and the soil’s organic matter cycle are. From the chromatogram, we can determine the enzymatic activity of the soil’s bacteria, as well as how fungal hyphae interweave and stabilize the soil structure.
What does science say about this?
The question arises: How reliable is this method from a scientific standpoint? Although Pfeiffer’s method was originally based on a qualitative, almost artistic interpretation, modern research has sought to quantify the relationship between chromatogram characteristics and measurable soil properties.
Several studies have addressed this issue in recent years. In an Italian study, Kokornaczyk et al. (2017) demonstrated that the patterns in the chromatograms show a close correlation with soil organic matter content, total nitrogen, and available phosphorus. (Kokornaczyk et al., 2017, DOI: 10.1080/01448765.2016.1214889).
In a Brazilian study Graciano and his colleaguei (2020) analyzed the zones of the chromatogram in detail and found that the intermediate zone is related to the amount of microbial biomass, while the outer zone is associated with the activity of certain soil enzymes. https://doi.org/10.5296/jas.v8i3.16336.
A Colombian study (Aguirre et al., (, 2019) showed that the method is effective at distinguishing between different land-use systems, such as forest soils and intensively farmed areas. https://doi.org/10.4067/s0718-07642019000600337.
Based on research, circular chromatography does not replace laboratory tests, but it can be effectively used as a supplementary tool for assessing the overall condition of the soil.
Why might this be of interest to farmers?
Perhaps the greatest strength of circular chromatography lies not in its accuracy, but in its ability to shape one’s perspective. It is an inexpensive and relatively simple method that provides rapid feedback and does not require a laboratory setting. In return, it helps us see the soil in context.
For example, a farmer can compare the chromatograms of a plowed field and a no-till field. Or he can see how the soil profile changes over the course of a few years cover crop-after use.
However, the method has its limitations, which it is important to understand clearly. Interpreting the chromatogram is subjective to a certain extent and requires experience. The method does not provide exact nutrient values, nor does it replace official soil tests.
According to research, it is most useful for comparing different farming systems, monitoring changes in soil condition, and gaining insight into soil biological activity.
An Old, New Way to Monitor the Soil
One of the fundamental principles of soil-regenerating agriculture is to treat the soil as a living system. To do this, however, we must learn to recognize changes. Pfeiffer’s circular chromatogram, which dates back nearly a century, can be an excellent tool for this. It shows us where we stand on the path to soil regeneration and certainly teaches us humility. Soil regeneration and improvements in soil quality and health do not happen overnight. On the Gässler family farm, they’ve been building up the soil for more than two decades, and the chromatograms starkly reveal that there’s still room for improvement. This is not a miracle cure, nor does it replace laboratory data. But it is a tool that can bring farmers closer to understanding how their own soil works.
AUTHOR: VÍG VITÁLIA • SOIL ECOLOGIST, EDUCATIONAL PROGRAM MANAGER FOR THE ASSOCIATION OF SOIL REGENERATION FARMERS, FOUNDER OF TERRAVITKA
 English
  Magyar
  Deutsch
  Slovenčina
  Українська
  Polski
  Русский
  Slovenščina